SQL Server
Counting the rows in a table
If you need to find how many rows there are in a table the simplest method that works across most databases is to use the “select count(*) from <table name>”.
The way Microsoft’s SQL Server manages the request is to find the narrowest index or the table and use that to scan it for the number of rows. For MySql it used to be selecting a known narrow indexed column, like the id, would result in a quicker result but I don’t know if recent versions are better…
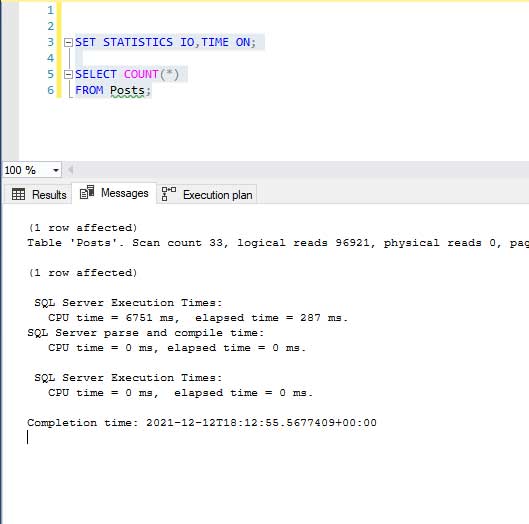
With MS SQL Server if we turn on statistics for IO (to show blocks read) and time (this is less helpful) to give an indication of the load on resources when we run the query.
I’m using SQL Server Management Studio (SSMS) 18.10 and SQL Server 2019. The statistics information will be shown in the messages tab of the output from the query:
SET STATISTICS IO, TIME ON;

SELECT COUNT(*)
FROM Posts;
Clicking on the messages tab in the SSMS after the select count has been run we can see that we had “logical reads 96921”. This means we had 96,921 blocks read to calculate the number of rows in the Posts table.
1 ms + 225 ms = 226 ms compile and execute time.
SQL Server parse and compile time:
CPU time = 0 ms, elapsed time = 1 ms.
(1 row affected)
Table ‘Posts’. Scan count 33, logical reads 96921, physical reads 0, page server reads 0, read-ahead reads 0, …
SQL Server Execution Times:
CPU time = 6499 ms, elapsed time = 225 ms.
If we look at the blocks read and the execution plan it shows it scanned of the index to calculate the row count:

A more efficient way to collect the row count of a table is from its statistics which are maintained by the system. The query is more complicated and it’s harder to remember but if you need quick results it’s very fast.
The SQL code below is from Pinal Dave’s post: Fastest Way to Retrieve Rowcount for a Table.
I have altered it so that it only returns the row count to match the first query.
SELECT SCHEMA_NAME(t.schema_id) SchemaName,
 t.[name] TableName,
 SUM(p.row_count) TotalRows
FROM sys.tables t
 INNER JOIN sys.dm_db_partition_stats p
 ON t.object_id = p.object_id
 AND t.type_desc = 'USER_TABLE'
 AND p.index_id IN ( 0, 1 )
WHERE t.[name] = 'Posts'
GROUP BY t.schema_id,
 t.[name]
ORDER BY TotalRows DESC;
Looking at the number of blocks read and the time to run:
SQL Server parse and compile time:
CPU time = 43 ms, elapsed time = 43 ms.
(1 row affected)
Table ‘syssingleobjrefs’. Scan count 3, logical reads 6, physical reads 0,,…
Table ‘sysidxstats’. Scan count 3, logical reads 6, physical reads 0,…
Table ‘sysrowsets’. Scan count 1, logical reads 5, physical reads 0,…
Table ‘syspalnames’. Scan count 0, logical reads 2, physical reads 0,…
Table ‘sysschobjs’. Scan count 1, logical reads 4, physical reads 0,…
SQL Server Execution Times:
CPU time = 0 ms, elapsed time = 28 ms.
So, 6 + 6 + 5 + 2 + 4 = 23 blocks in total are read. This is considerably smaller than 96,921 blocks with the first query.
43 ms + 28 ms = 61 ms – so this too is also far quicker to run than the first query (226 ms).
Obviously, the query plan is considerably more complex than the ‘select count’ but it if far more resource-efficient:

It’s not that often we need to know the number of rows in a table which is time-critical as normally the result are returned quite quickly and it’s easy to remember the ‘select count’ SQL query.
If resources and/or time is important then you can use the query to collect the data from the statistics but you’ll need to retrieve the query as I know I won’t remember it from memory.


